Winter brings many challenges, but one of the most serious for homeowners is a burst water pipe. This problem can lead to major water damage, expensive repairs, and even long-term issues with mold. Understanding why water pipes burst in winter is not just for plumbers.
Anyone living in a cold climate should know the risks, warning signs, and smart ways to prevent disaster. With clear explanations, real-world examples, and expert advice, this article will help you protect your home and avoid costly surprises.
What Causes Water Pipes To Burst In Winter
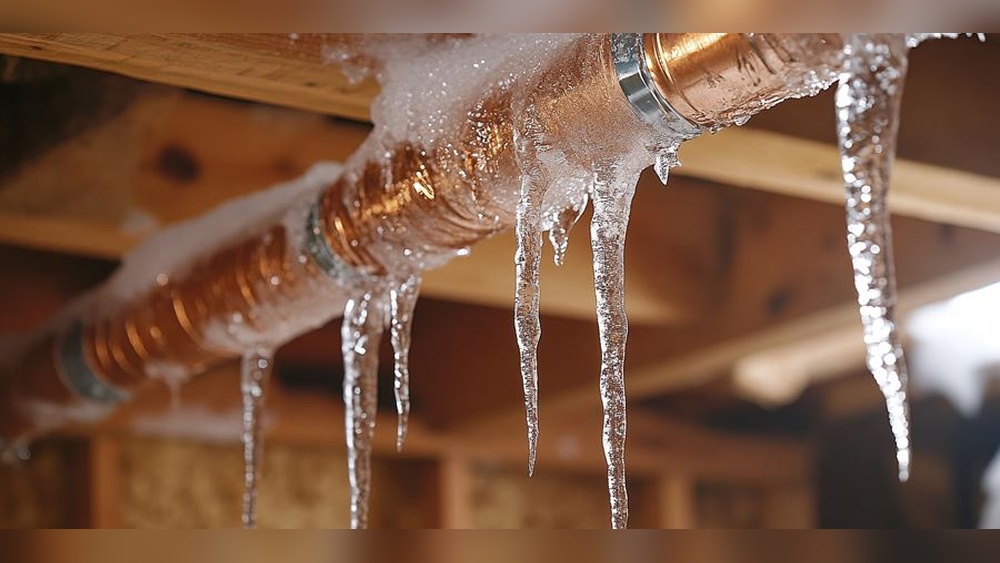
Most pipe bursts in winter are caused by a simple process: water freezing inside the pipe. When temperatures drop below 0°C (32°F), the water in unprotected or exposed pipes can freeze. Unlike many materials, water expands by about 9% when it turns to ice. This expansion puts pressure on the pipe’s walls. If the pressure gets too high, the pipe will crack or burst.
Even strong metal pipes can fail under this force. According to the Insurance Institute for Business & Home Safety, a pipe exposed to freezing air for just a few hours can burst, releasing up to 250 gallons (about 950 liters) of water per day if not stopped.
Key factors that lead to burst pipes include:
Poor insulation around pipes
Sudden cold snaps or very low temperatures
Pipes located in unheated areas (attics, basements, garages)
Small cracks or leaks that let cold air reach the pipe
How Freezing Water Damages Pipes
The actual break often does not happen where the ice forms. Instead, ice usually blocks the pipe and creates a pressure build-up between the blockage and a closed tap. As water freezes and expands, it pushes unfrozen water further down the pipe.
When the pressure becomes too great, the pipe bursts—often several feet away from the ice plug.
Copper, PVC, and even PEX pipes are all at risk. In fact, research from the University of Illinois found that PVC pipes can burst at lower pressures than copper, often failing at just 300 psi, while copper can withstand up to 1500 psi before breaking.
Credit: www.bristolwater.co.uk
Why This Problem Matters
A burst pipe can flood a room in minutes. The cost of water damage repair in the US averages $5,000 to $7,000 per incident, not including the price to replace the broken pipe. In colder regions, insurance claims for frozen pipe damage reach over $1 billion every year.
Beyond money, there are health risks. Water soaking into walls and floors can create mold in as little as 24 to 48 hours. Mold can cause breathing problems, especially in children or people with allergies.
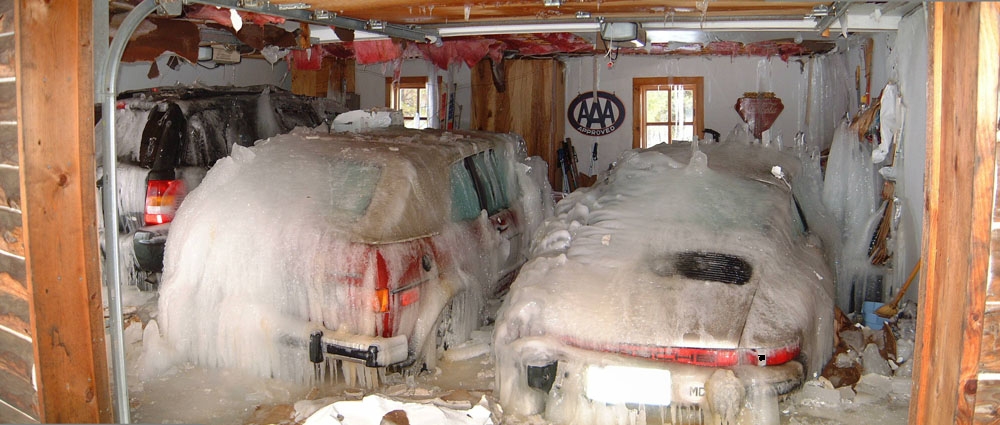
Practical Examples Of Winter Pipe Bursts
Many people think pipe bursts only happen in old or run-down homes. In reality, even new homes are at risk if pipes are not properly insulated or installed.
Example 1: A family in Chicago left their home unheated while traveling in January. Temperatures dropped to -15°C (5°F), causing a pipe in the basement to freeze and burst. When they returned, their entire basement was flooded with 400 gallons (over 1,500 liters) of water.
Example 2: In the UK, 2018’s “Beast from the East” cold wave caused over 20,000 pipe burst claims in just one month, with repair costs topping £194 million, according to the Association of British Insurers.
Signs Your Pipes Are At Risk Or May Freeze
Spotting the warning signs early can prevent a disaster. Here are the top indicators that your pipes might freeze or burst soon:
Reduced water flow from taps, especially in cold weather.
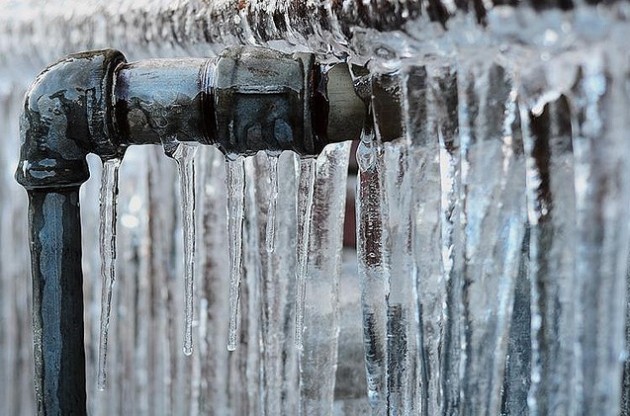
Frost on exposed pipes in your basement, garage, or attic.
Strange sounds such as banging, whistling, or bubbling from the plumbing.
Unusual odors coming from drains (could mean a blockage or ice plug).
Sudden drops in temperature inside areas where pipes run.
If you notice any of these, act quickly before the pipe bursts.
Step-by-step: How To Prevent Pipes From Freezing And Bursting
Protecting your pipes takes a bit of planning but can save thousands. Here is a step-by-step guide:
Identify at-risk pipes. Look for pipes in unheated spaces or near outside walls.
Add insulation. Use foam pipe sleeves, especially for pipes in attics, basements, and crawl spaces.
Seal leaks and gaps. Close holes in walls, windows, and floors where cold air can enter.
Let faucets drip. Allowing a small stream of water to flow keeps pressure low and water moving.
Keep heat on. Never let indoor temperatures fall below 12°C (54°F), even if you are away.
Open cabinet doors. Let warm air reach pipes under sinks, especially at night.
Install pipe heating cables. These electric cables keep pipes warm and are a good investment for extreme cold.
Shut off and drain outdoor pipes. Disconnect hoses and shut off water to exterior faucets before winter.
Monitor temperature drops. Use pipe temperature sensors or smart home apps for alerts.
Credit: www.pac-plumbing.com
Common Problems And Solutions
Even with good preparation, issues can still happen. Here are some common problems and how to solve them:
Problem: Frozen Pipe (but Not Burst)
Solution: Turn off the main water supply. Use a hair dryer, heating pad, or warm towel to gently thaw the pipe. Never use an open flame, as it can cause fires or damage.
Problem: Pipe Already Burst
Solution: Shut off the main water valve immediately. Open all faucets to reduce pressure. Call a plumber as soon as possible. Remove valuables and start drying the area to prevent mold.
Problem: Repeated Freezing In Same Spot
Solution: This usually means poor insulation or a cold air leak. Add extra insulation and check for gaps in walls or floors. In some cases, reroute the pipe away from cold areas.
Problem: High Water Bill But No Visible Leak
Solution: Water can escape under floors or behind walls. Check your water meter. If it runs when all taps are off, you may have a hidden leak. Contact a professional for leak detection.
Maintenance Tips For Winter Pipe Safety
Staying ahead of the cold is key. Use these expert tips to keep your pipes safe all winter:
Check insulation every autumn. Replace any worn or damaged pipe covers.
Keep garage doors closed. Many pipes run through garages, which get cold quickly.
Know your main water shutoff location. Mark it with a tag for quick action in emergencies.
Schedule a yearly plumbing inspection. A professional can spot risks you might miss.
Test your sump pump. If your basement floods due to a burst pipe, a working sump pump can reduce damage.
Key Data And Comparison Table
Here is a summary of important facts about frozen pipes, risk temperatures, and recovery costs:
Factor
Value
Notes
Pipe burst risk temp
Below -6°C (20°F)
Majority of bursts occur at this point
Average repair cost
$5,000 – $7,000
Water damage and labor included
Water wasted per burst
Up to 950 liters/day
Depends on pipe size and response time
Time for mold to grow
24 – 48 hours
After water exposure
Pipe material burst pressure
300 – 1500 psi
PVC fails sooner than copper
Why Pipe Material And Location Matter
Not all pipes are equally at risk. Copper pipes are common in older homes and are more resistant to freezing but will eventually burst under extreme pressure. PVC pipes are cheaper and used in newer construction but are more brittle in cold temperatures.
Location also plays a big role. Pipes running along exterior walls, under floors, or in crawl spaces freeze first because they are less protected from the cold. According to the American Red Cross, 37% of all burst pipe claims come from basements and crawl spaces.
Credit: www.modernistic.com
Non-obvious Insights Most People Miss
Pipes can freeze even if not exposed. Many people think only visible pipes are at risk. In reality, pipes inside poorly insulated walls can freeze without any outside sign.
Tiny cracks cause massive leaks. A crack just 1/8 inch (3 mm) wide in a pipe can leak up to 250 gallons (950 liters) of water per day, damaging floors and foundations before you notice.
Frequently Asked Questions
Why Do Pipes Burst Instead Of Just Leaking When Frozen?
When water freezes, it expands. This expansion creates pressure between the ice blockage and the closed faucet, eventually splitting the pipe. Unlike a slow leak, the break is sudden and can release large amounts of water at once.
Are All Pipes In My House At The Same Risk Of Freezing?
No. Pipes in unheated areas such as attics, basements, garages, or along exterior walls are at much higher risk. Insulated and interior pipes are safer but still need some attention during extreme cold.
How Can I Tell If A Pipe Is Frozen Before It Bursts?
Look for very weak water flow, frost on the pipe’s surface, or strange noises when you turn on the tap. If you suspect a frozen pipe, act quickly to thaw it and avoid a burst.
Should I Turn Off My Water When Leaving For Vacation In Winter?
Yes. Turning off the main water supply and draining the system is the best way to prevent damage if a pipe freezes and bursts while you are away. Some smart home systems can also alert you to leaks.
What Should I Do If My Pipes Keep Freezing Every Winter?
Increase insulation around the pipes, seal air leaks, and consider rerouting pipes away from cold areas. For severe climates, installing pipe heating cables can provide extra protection.
Key Takeaways
Understanding why water pipes burst in winter is essential for every homeowner. Freezing water expands, causing dangerous pressure that can break pipes and flood your home. By knowing the risk factors, signs, and steps for prevention, you can avoid the high costs and health hazards of water damage.
Hasan Al Sarker is a Reverse Osmosis Specialist. He has worked for many years to ensure safe drinking water for all. His research paper has been published in several journals, including Issue, Medium, and Slideshare. He is recognized as a water doctor among specialists though he did not attend medical college.
Besides working as a researcher of reverse osmosis technology, he is also very fancy with the kitchen and cooking. His guides are reading thousands of people every day. As a head of content, he is responsible for all the published articles at RO System Reviews.
Most people use plastic bottles for storing and drinking water every day. It seems simple and safe, but have you ever wondered what really happens when water sits in plastic bottles for days, weeks, or even months? As someone who has studied water safety and plastic materials for years, I can tell you there is much more going on than meets the eye.
From chemical leaching to taste changes, and even potential health risks, the story is both fascinating and important for anyone who cares about clean drinking water.
In this article, I will break down how water and plastic interact, what changes can occur over time, and why it matters for your health. I will also share clear signs you should watch for, plus steps to keep your water safe and fresh.
You will find solid data, practical tips, and real-world examples to help you make smart choices about bottled water storage.
Understanding Water In Plastic Bottles
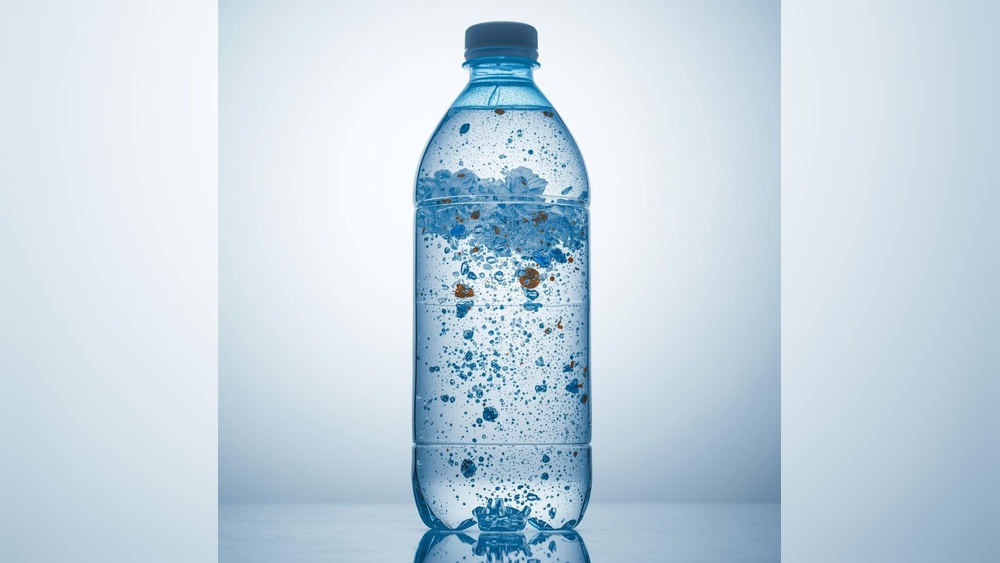
Plastic bottles are usually made from polyethylene terephthalate (PET) or high-density polyethylene (HDPE). These plastics are chosen because they are lightweight, strong, and relatively cheap to produce. However, they are not completely inert. When water sits inside these bottles, a slow exchange can occur between the plastic and the water.
The main concern is chemical leaching. Over time, small amounts of chemicals from the plastic can move into the water. These chemicals include antimony, bisphenol A (BPA), and phthalates, depending on the type of plastic. Factors like heat, sunlight, and storage time speed up this process.
How Chemical Leaching Works
Chemical leaching happens when molecules from the plastic break free and dissolve into the water. This process is slow at first but speeds up with heat and time. For example, a study found that PET bottles can release up to 0.05 mg/L of antimony after sitting for three months at room temperature. If the bottle is left in direct sunlight or high temperatures, leaching can increase up to three times faster.
Here is a summary of how different conditions affect chemical leaching:
Factor
Impact on Leaching
Measured Increase
Room Temperature (25°C)
Slow leaching
0.05 mg/L antimony after 3 months
High Temperature (50°C)
Fast leaching
0.15 mg/L antimony after 3 months
Exposure to Sunlight
Very fast leaching
Up to 3x more chemicals
Why This Matters For Your Health
Most bottled water brands claim their products are safe, but research shows that long-term exposure to chemicals like antimony and BPA could harm your health. Antimony is linked to problems with the stomach and lungs, while BPA can affect hormones. The World Health Organization (WHO) sets a guideline of 0.005 mg/L for antimony in drinking water. Some bottled water samples stored for months have come close to or even exceeded this limit.
Even if you drink bottled water only occasionally, it is important to know that these chemicals build up slowly in your body. People who reuse bottles or store them in cars during summer are at higher risk.
Practical Examples: What Really Happens
Let’s look at a few real-life scenarios to see what actually happens:
Water left in a car: If you leave a plastic water bottle in your car on a hot day (above 40°C), you can expect chemical levels to rise quickly. A study in Arizona found that antimony levels in PET bottles doubled after just one week in a parked car.
Bottled water stored at home: When bottles are kept in cool, dark places, chemical leaching is much slower. However, after six months, taste changes are often noticeable. Some people report a plastic or stale flavor.
Reusing plastic bottles: Many people refill single-use bottles. After repeated use and washing, micro-cracks form in the plastic, increasing the risk of chemical leaching and bacterial growth.
Credit: www.townandcountrytoday.com
Signs Your Bottled Water Is No Longer Safe
It is not always easy to tell when water has gone bad, but there are warning signs:
Strange taste: Water tastes bitter, plasticky, or stale.
Unusual smell: A chemical or musty odor.
Cloudiness: Water that should be clear appears cloudy or has floating particles.
Bottle deformation: The bottle feels softer, looks warped, or has changed color.
If you notice any of these signs, it is best to avoid drinking the water.
Step By Step: Keeping Bottled Water Safe
You can reduce risks and keep your water fresh by following these steps:
Check the expiration date: Most bottled water has a shelf life of 1-2 years. Always use it before this date.
Store in a cool, dark place: Heat and sunlight speed up chemical leaching. Keep bottles away from windows and cars.
Avoid reusing single-use bottles: They are not designed for repeated use. Instead, use bottles labeled BPA-free and made for reuse.
Inspect bottles before drinking: Look for cracks, soft spots, or discoloration.
Finish opened bottles quickly: Once opened, use the water within a few days.
Credit: www.vecteezy.com
Common Problems And Solutions
Problem: Bad Taste Or Smell
Solution: Discard the water. Do not try to mask the taste with flavorings, as the underlying chemical contamination can still be harmful.
Problem: Cloudy Water
Solution: This may indicate bacterial growth or plastic breakdown. Never drink cloudy water from plastic bottles.
Problem: Bottle Left In Hot Car
Solution: Even if the water looks fine, heat speeds up leaching. Replace the bottle and do not drink from it.
Problem: Reusing Bottles For Months
Solution: Switch to a reusable, BPA-free bottle. Regularly wash it with hot, soapy water and let it dry completely.
Problem: Expired Bottled Water
Solution: While water itself does not expire, the plastic can degrade. Always use water before the printed expiration date.
Maintenance Tips For Bottled Water Storage
Rotate stock: Use older bottles first and regularly check expiration dates.
Keep bottles sealed: Opened bottles allow air and bacteria inside.
Clean storage areas: Dust and dirt can contaminate bottle surfaces.
Avoid freezing: Freezing can crack plastic, allowing more chemicals to leach.
Choose safer plastics: Look for bottles marked PET or HDPE, and avoid those labeled with recycling codes 3 or 7.
Key Data At A Glance
Here is a quick comparison of how water quality changes in plastic bottles under different conditions:
Storage Condition
Expected Shelf Life
Main Risks
Cool, dark place
12-24 months
Slow chemical leaching, mild taste change
Exposed to sunlight
1-3 months
Fast chemical leaching, plastic taste
Hot car
1-2 weeks
Very fast leaching, possible bacterial growth
Reused single-use bottle
Not recommended
High risk of chemicals and bacteria
Frequently Asked Questions
How Long Can I Safely Store Water In A Plastic Bottle?
Unopened bottled water kept in a cool, dark place can last up to two years. However, for best quality, use it within 12 months and always check for signs of spoilage.
Is It Dangerous To Drink Water From A Bottle Left In A Hot Car?
Yes, heat speeds up chemical leaching from the plastic. Even if the water looks and smells normal, it may contain unsafe levels of chemicals such as antimony or BPA.
Can I Reuse Plastic Water Bottles?
Single-use bottles are not designed for reuse. They can develop cracks and release more chemicals over time. If you need to reuse, choose bottles labeled BPA-free and made for multiple uses.
Why Does My Bottled Water Taste Like Plastic After A While?
This is usually caused by chemical leaching from the plastic into the water. Heat, sunlight, and long storage times make this problem worse.
Is There A Safer Alternative To Plastic Bottles?
Yes, stainless steel or glass bottles do not leach chemicals and are reusable. If you must use plastic, look for PET or HDPE bottles and avoid exposing them to heat.
Credit: bushlife.ca
Key Takeaway
Water stored in plastic bottles is not as simple as it seems. Time, temperature, and bottle quality all affect water safety. For the best health, store water in cool, dark places, avoid reusing single-use bottles, and watch for signs of spoilage.
Being informed helps you protect yourself and your family from hidden risks.
For more detailed safety information, you can visit the World Health Organization and Centers for Disease Control and Prevention websites. These resources offer up-to-date research and best practices for safe water storage. Stay aware, make smart choices, and your bottled water will be both safe and refreshing.
Hasan Al Sarker is a Reverse Osmosis Specialist. He has worked for many years to ensure safe drinking water for all. His research paper has been published in several journals, including Issue, Medium, and Slideshare. He is recognized as a water doctor among specialists though he did not attend medical college.
Besides working as a researcher of reverse osmosis technology, he is also very fancy with the kitchen and cooking. His guides are reading thousands of people every day. As a head of content, he is responsible for all the published articles at RO System Reviews.
The sulfur smell in water is a common issue that can affect homes, businesses, and even public water supplies. If you have ever noticed a rotten egg odor when running your tap, you are not alone. This smell can make water unpleasant to drink, bathe with, or use for cooking. The problem often signals something deeper about your water source, plumbing, or treatment system. Understanding the causes, signs, and solutions is key to restoring clean, odor-free water.
Understanding Sulfur Smell In Water
The main cause of the sulfur smell is hydrogen sulfide gas. When this gas dissolves in water, it produces a distinct odor similar to rotten eggs. Hydrogen sulfide can be naturally present in groundwater or produced by bacteria. The smell can be strong or weak, depending on the concentration.
Hydrogen sulfide levels are measured in milligrams per liter (mg/L). Even as little as 0. 05 mg/L can create a noticeable odor. Most public water systems aim to keep levels below 0. 1 mg/L. According to the U. S. Geological Survey, some private wells in rural areas may have levels as high as 1–5 mg/L.
How Sulfur Smell Develops
Hydrogen sulfide forms in several ways:
Bacterial activity: Certain bacteria, called sulfur bacteria, thrive in low-oxygen environments. They convert natural sulfur compounds into hydrogen sulfide gas.
Organic matter decay: Decomposing leaves, plants, or other organic materials in wells or pipes can release hydrogen sulfide.
Chemical reactions: Water with high levels of sulfate can react with plumbing metals, especially iron, to produce hydrogen sulfide.
Groundwater geology: Some rocks and soils naturally contain sulfur. When water moves through these layers, it picks up hydrogen sulfide.
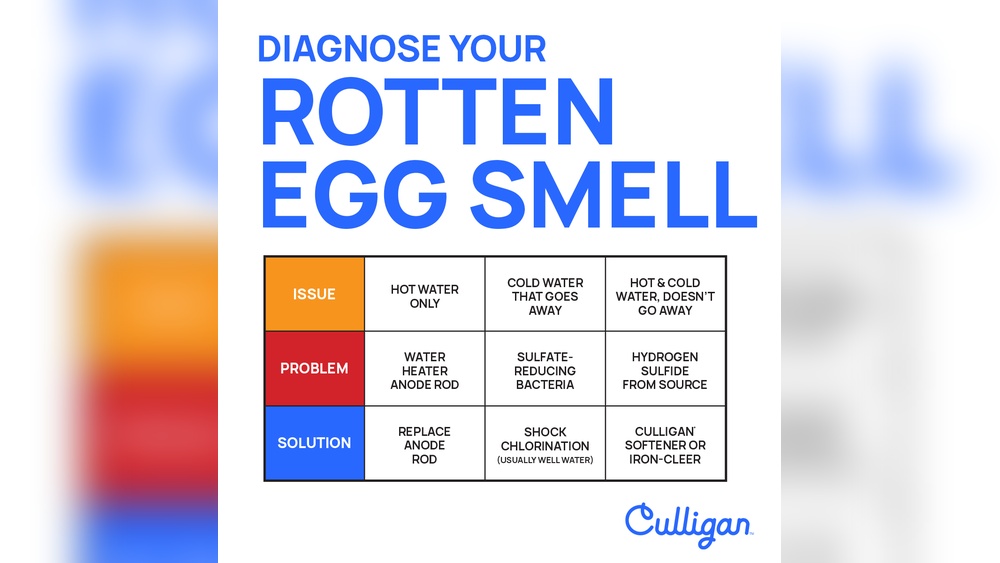
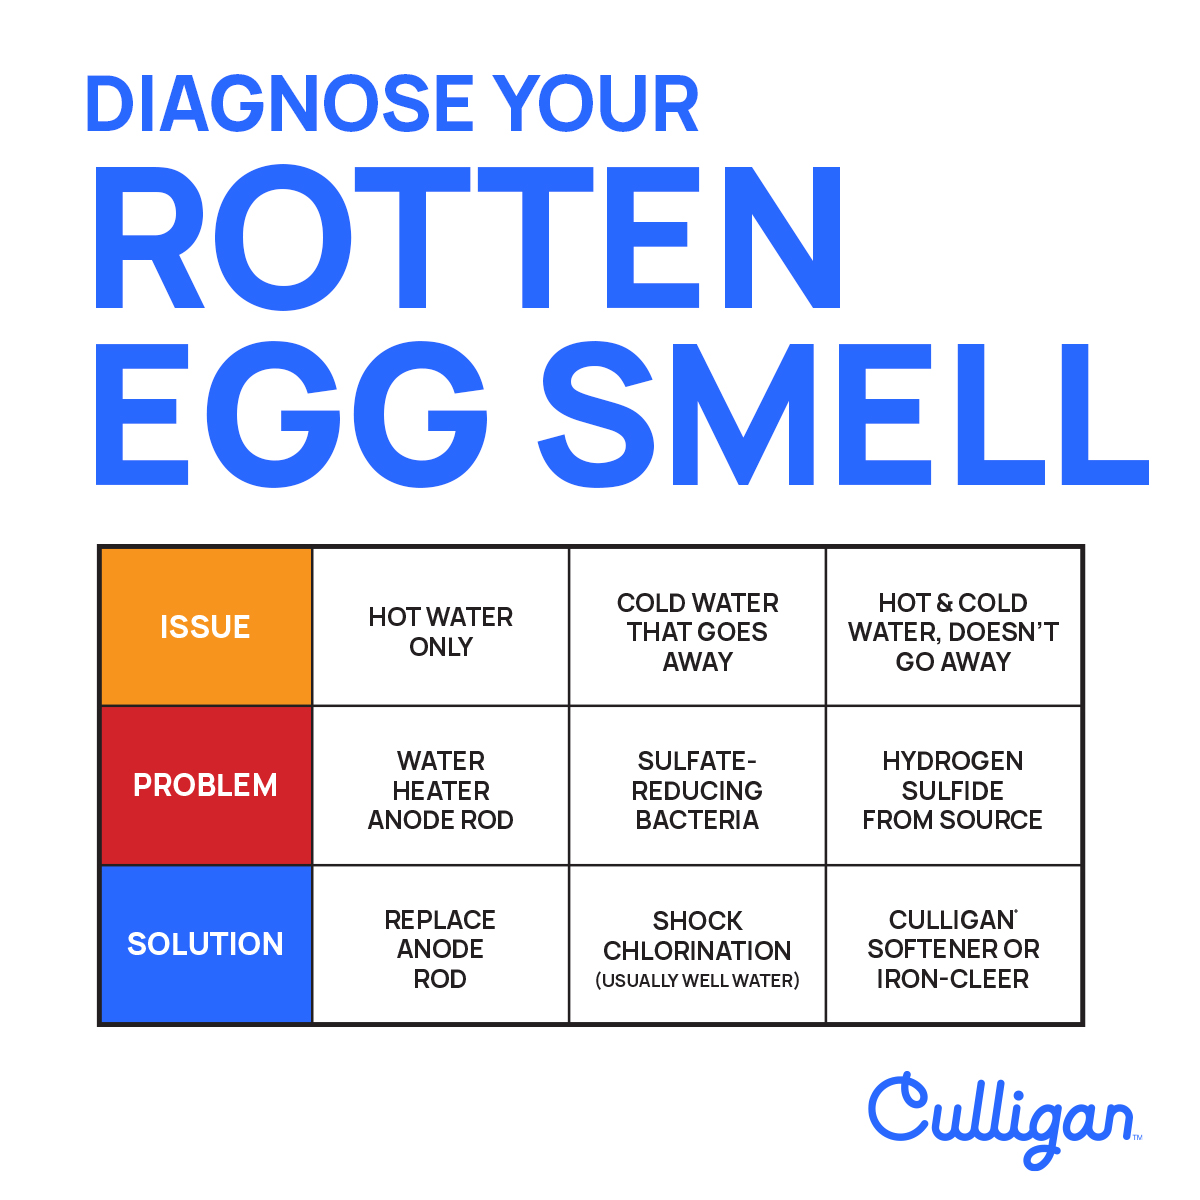
Credit: culliganlaoc.com
Why Sulfur Smell Matters
The sulfur smell is more than just an inconvenience. It can signal problems with water quality and affect health, plumbing, and daily life.
Health risks: While low levels are not usually dangerous, high concentrations can cause nausea, headaches, or worsen asthma. Levels above 2 mg/L may irritate eyes and respiratory tract.
Plumbing damage: Hydrogen sulfide can corrode pipes, especially copper and iron. This leads to leaks and costly repairs.
Staining: Water with sulfur can leave black stains on sinks, tubs, and laundry.
Taste and odor: The smell and taste make water unpleasant, reducing its use for drinking and cooking.
Practical Examples And Real-life Cases
Let’s look at real situations:
Rural wells: In states like Florida and Texas, over 12% of private wells report sulfur odor due to natural geology and bacteria.
Municipal systems: In 2022, a city in Ohio received 500+ complaints about sulfur smell after a flood contaminated local wells.
Homes with water heaters: Many calls to plumbers come from homes where the odor appears only in hot water. This is often due to bacteria in the water heater.
Seasonal changes: After heavy rains, organic material may enter wells, raising hydrogen sulfide levels by up to 0.5 mg/L.
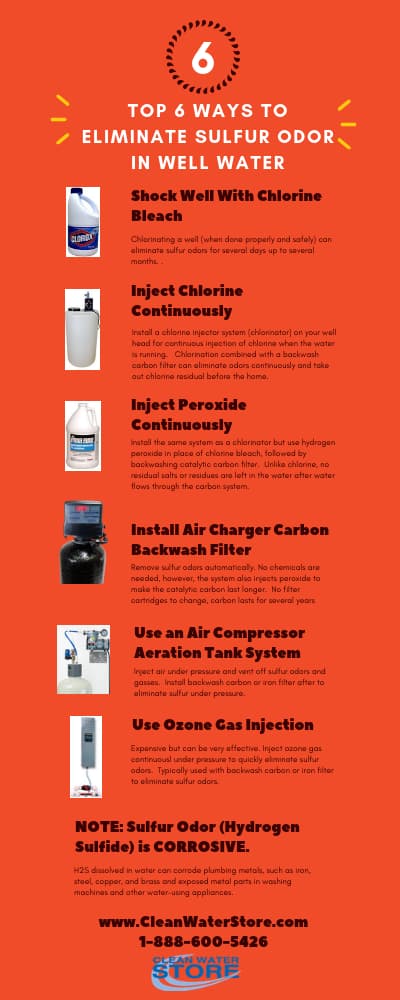
Credit: www.cleanwaterstore.com
Signs And Indicators Of Sulfur Smell
Recognizing the problem is the first step. Here are some clear indicators:
Rotten egg odor: Most noticeable when running taps or showers.
Black stains: Found on bathroom fixtures or laundry.
Metallic taste: Some water may taste odd due to hydrogen sulfide.
Odor only in hot water: This points to the water heater as the source.
Odor in all taps: Suggests the issue is in the well or main supply.
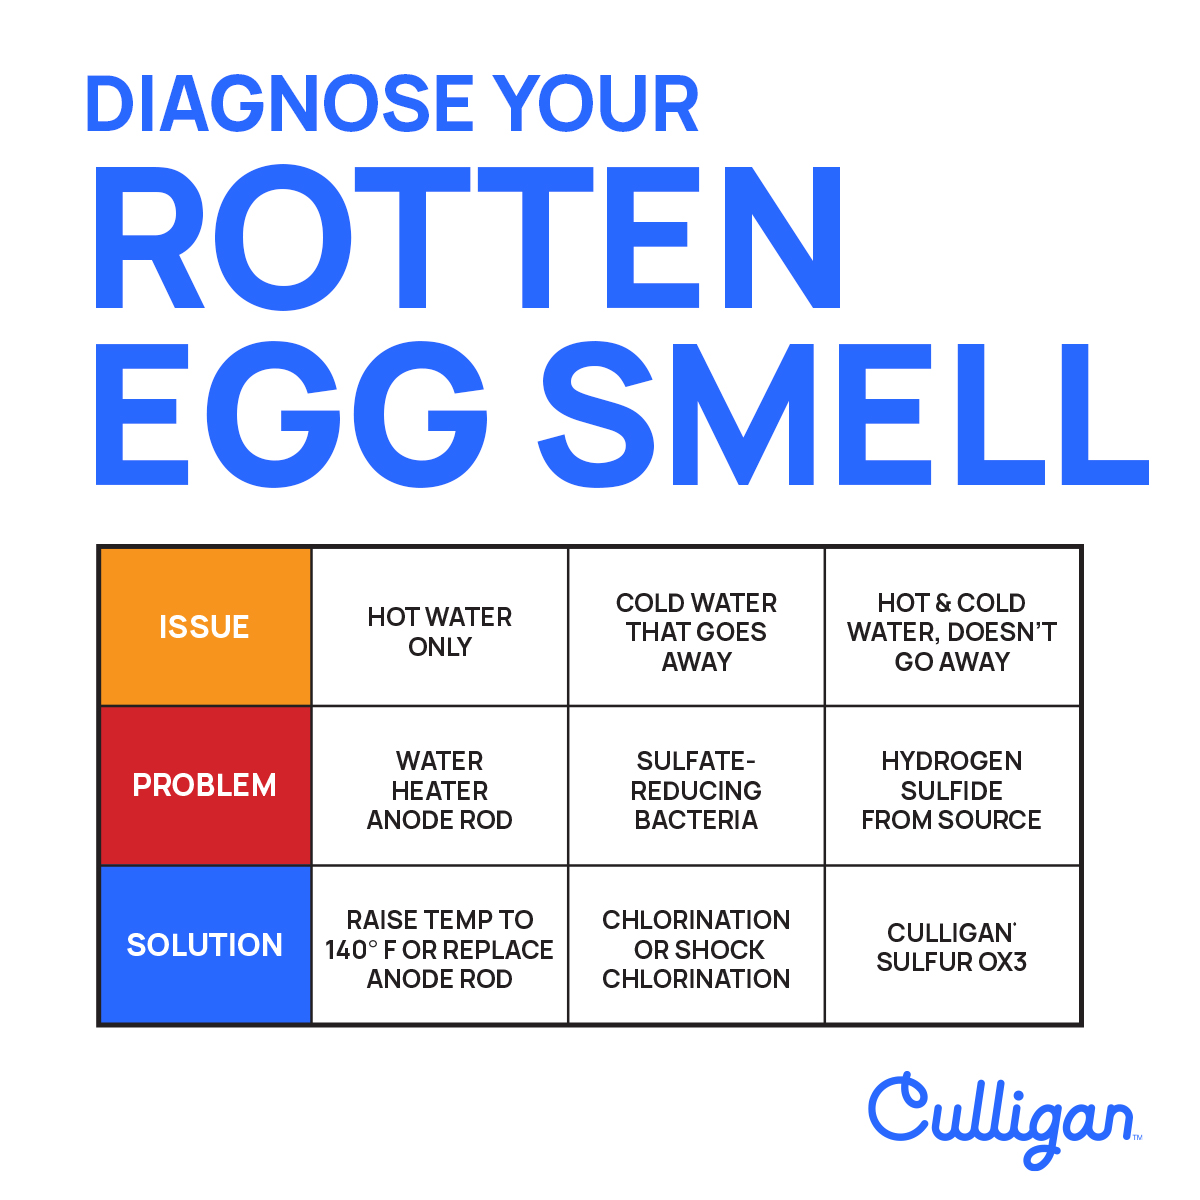
Step-by-step Guidance To Diagnose Sulfur Smell
To solve the sulfur smell, follow these steps:
Test your water: Use a certified lab or home test kit. Check for hydrogen sulfide, iron, and bacteria. Results usually take 1–3 days.
Identify affected taps: Note if the smell is present in all water or just hot/cold.
Inspect the water heater: Turn off the heater, drain it, and check for odor. Replace the magnesium anode rod with an aluminum one if needed.
Check the well: Inspect for organic matter or debris. Clean and disinfect the well if necessary.
Review plumbing: Look for corroded pipes or fittings. Replace damaged parts.
Consult local authorities: If using public water, contact your utility for help.
Common Problems And Solutions
Sulfur smell can be stubborn, but most causes have clear solutions.
Problem 1: Bacteria In Water Heater
Solution: Flush the heater. Replace the magnesium anode rod with an aluminum-zinc rod. Set the temperature above 140°F (60°C) for a few hours to kill bacteria.
Problem 2: Sulfur Bacteria In Well
Solution: Shock chlorinate the well. Use 1–2 gallons of household bleach per 100 gallons of water. Let it sit 12–24 hours, then flush.
Problem 3: Natural Hydrogen Sulfide In Groundwater
Solution: Install an activated carbon filter or aeration system. Activated carbon removes odors, while aeration vents hydrogen sulfide gas.
Problem 4: Corroded Pipes
Solution: Replace corroded sections with plastic or stainless steel. Regularly inspect plumbing.
Problem 5: Seasonal Contamination
Solution: Clean wells after storms. Install well caps to prevent organic debris.
Maintenance Tips For Odor-free Water
Regular care can prevent sulfur smell. Here are expert tips:
Test water annually: Use a certified lab to check for hydrogen sulfide and bacteria.
Flush water heaters: Every 6–12 months, drain and flush to remove bacteria.
Clean wells: Remove debris and disinfect after floods or heavy rains.
Check filters: Replace carbon filters every 6 months.
Inspect plumbing: Look for corrosion and leaks.
Use aeration: For persistent odor, install an aeration unit or contact a water treatment professional.
Comparison Table: Causes And Solutions
Here is a summary of key causes and best solutions.
Cause
Typical Hydrogen Sulfide Level (mg/L)
Main Solution
Cost Estimate (USD)
Bacteria in water heater
0.1–1.0
Flush heater, replace rod
50–200
Sulfur bacteria in well
0.5–5.0
Shock chlorination
100–300
Natural groundwater hydrogen sulfide
0.1–5.0
Carbon filter or aeration
200–800
Corroded pipes
N/A
Pipe replacement
150–500
Organic matter decay
0.1–2.0
Well cleaning
100–400
Why Hydrogen Sulfide Is Often Overlooked
Many people ignore the sulfur smell, thinking it is harmless. However, hydrogen sulfide can cause real problems. It may hide more serious issues like plumbing corrosion or bacterial contamination. In rural areas, well owners may not test water regularly, missing rising hydrogen sulfide levels.
City water users often assume their supply is always safe, but events like floods or pipe breaks can introduce sulfur bacteria.
A non-obvious insight is that even small changes in water chemistry can increase odor. For example, using a new water softener or changing plumbing materials can release more hydrogen sulfide. Another overlooked factor is temperature. Warm water speeds up bacterial activity, making odors worse in summer or after heating.
Expert Insights For Long-term Water Quality
From years of fieldwork, I can say regular testing is the single most effective step. Many clients who ignored testing saw problems get worse—plumbing damage and higher repair bills. Proper maintenance, such as flushing heaters and cleaning wells, prevents most odors.
Another tip: Always check both hot and cold taps. If only hot water smells, the heater is likely the source. If all taps smell, test your well or main supply.
Frequently Asked Questions
What Is Hydrogen Sulfide And Why Does It Smell Like Rotten Eggs?
Hydrogen sulfide is a gas that forms when sulfur bacteria break down organic matter. It smells like rotten eggs because it is the same compound released by decaying eggs and organic waste.
Is Sulfur Smell In Water Dangerous To Health?
Low levels usually do not harm healthy adults. However, higher concentrations above 2 mg/L can cause headaches, nausea, or worsen asthma. Babies and elderly people are more sensitive.
Can I Drink Water With A Sulfur Smell?
While the odor is unpleasant, it is not dangerous at low levels. If the smell is strong or you notice health symptoms, have your water tested and use a filter before drinking.
How Can I Remove The Sulfur Smell From Water?
Common solutions include flushing the water heater, shock chlorinating the well, and installing carbon filters or aeration units. Regular maintenance and testing also help prevent the smell.
Will Boiling Water Remove The Sulfur Smell?
Boiling water may reduce the odor slightly, but it does not remove hydrogen sulfide gas completely. Filtration or aeration is more effective for lasting results.
Credit: culliganontario.com
Key Takeaway
The sulfur smell in water is usually caused by hydrogen sulfide gas from bacteria, organic matter, or chemical reactions. It can lead to health concerns, plumbing damage, and staining. Regular testing, proper maintenance, and targeted solutions are the best ways to keep your water clean and odor-free. If you notice a rotten egg smell, act quickly to find and fix the cause. For more detailed information, visit the EPA Drinking Water resource and Wikipedia: Hydrogen Sulfide.
Hasan Al Sarker is a Reverse Osmosis Specialist. He has worked for many years to ensure safe drinking water for all. His research paper has been published in several journals, including Issue, Medium, and Slideshare. He is recognized as a water doctor among specialists though he did not attend medical college.
Besides working as a researcher of reverse osmosis technology, he is also very fancy with the kitchen and cooking. His guides are reading thousands of people every day. As a head of content, he is responsible for all the published articles at RO System Reviews.
Have you ever taken a sip of tap water and noticed a strong, metallic taste? This is a common experience in many homes and offices around the world. Sometimes, the metallic flavor is slight and goes away quickly. Other times, it is so strong that people avoid drinking their water.
Understanding why water tastes metallic is important for both your health and comfort. It can signal changes in your water supply or plumbing system. In this article, I will break down the main causes, explain the science behind the taste, and offer expert advice on how to identify and solve the problem.
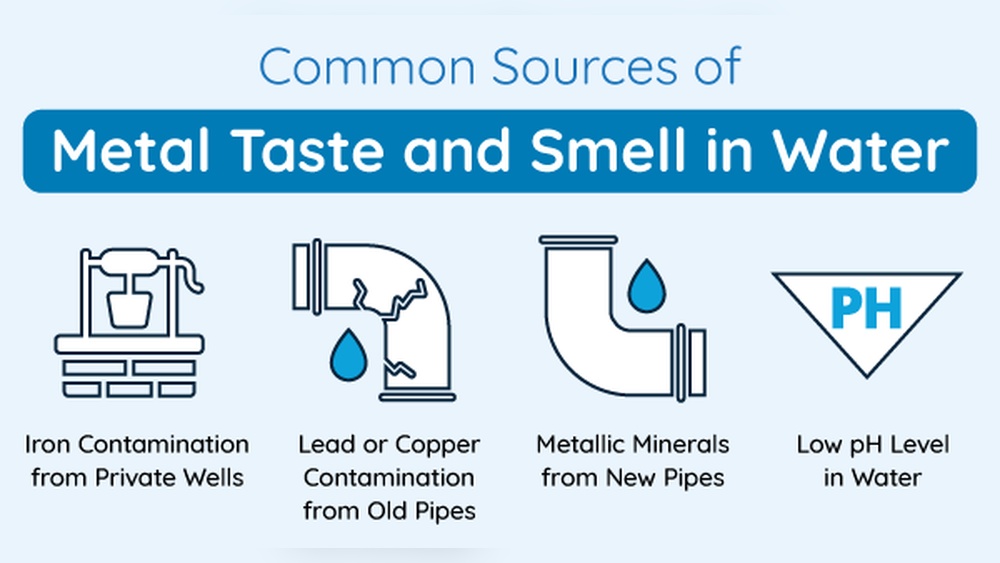
What Causes Metallic Taste In Water
A metallic taste in water usually means that certain metals have dissolved into your drinking water. This taste is most often linked to iron, manganese, zinc, or copper. These metals can enter your water supply in several ways.
Old pipes are a common source, especially in houses built before 1980. In other cases, high levels of natural minerals in the ground can add metals to well water. Sometimes, city water treatment processes change the water chemistry, leading to a metallic taste.
In rare cases, the taste can come from your own mouth. Certain medications or vitamin supplements can cause a metallic flavor when you drink water. However, in most cases, the water itself is the main source.
How Metallic Taste Develops
When water moves through metal pipes, small amounts of metal can dissolve into the water. This process is called corrosion. Acidic water, which has a low pH, speeds up corrosion. Water that sits in pipes overnight has more time to pick up metals, so the first glass in the morning often tastes the strongest.
If you use a private well, the metallic taste may come from the rocks and soil in your area. Groundwater naturally picks up minerals as it moves through the earth. If you live near old mines or industrial sites, there could be even higher levels of metals.
Municipal water systems also use chemicals to treat water and kill germs. Sometimes, these chemicals react with pipes and cause metals to leach into the supply.
Why Metallic Water Taste Matters
The taste of your water is not just about comfort. Sometimes, it signals a safety issue. High levels of metals can damage your plumbing, stain your laundry, and even affect your health if you drink them over a long period.
For example, the Environmental Protection Agency (EPA) sets the maximum level for iron in drinking water at 0.3 mg/L. For manganese, the limit is 0.05 mg/L. Water with higher levels may not be safe for regular use.
The table below shows the main metals that cause metallic taste and their recommended safe limits.
Metal
Safe Limit (mg/L)
Common Source
Health Impact
Iron
0.3
Old pipes, groundwater
Stomach upset, stains
Manganese
0.05
Soil, well water
Nerve damage (high exposure)
Copper
1.3
Plumbing, corrosion
Stomach cramps, nausea
Zinc
5.0
Galvanized pipes, fittings
Metallic taste, diarrhea
Practical Examples Of Metallic Water
Let me share some real-world cases from my experience as a water quality expert.
In one home, the owners noticed a strong metallic taste every morning. Testing showed high iron levels. Their house used old steel pipes, and the taste went away after installing a new filter.
Another family with a private well found their water tasted like metal after heavy rain. This was due to surface water entering their well and picking up manganese from the soil.
In city apartments, the taste often appears when plumbing repairs happen. New copper pipes can release small amounts of metal for the first few weeks.
Signs And Indicators Of Metallic Water
You can spot metallic water with your senses and simple tests. Look for these clear signs:
Unpleasant metallic taste in cold or hot water
Reddish or brown stains on sinks, tubs, or laundry
Cloudy or rusty water when you first turn on the tap
Blue-green stains (from copper) on fixtures
Strange odor, sometimes described as “musty” or “earthy”
A water test kit can confirm the presence of metals. Most kits measure iron, manganese, copper, and zinc levels.
Step By Step Guidance To Identify And Fix Metallic Taste
Here is my recommended approach if you notice a metallic taste in your tap water.
1. Check Multiple Taps
Taste water from different faucets. If only one tap has a problem, the issue may be local, such as a corroded fixture.
2. Run The Water
Let the water run for two minutes. If the taste goes away, the metals are probably from your home’s pipes, not the main supply.
3. Inspect For Stains
Look for reddish, brown, or blue-green stains. Iron leaves reddish stains, while copper causes blue-green marks.
4. Test Your Water
Buy a home test kit or call a certified lab. Test for iron, manganese, copper, and zinc. Compare results with EPA safe limits.
5. Check With Neighbors
Ask if others on your street have the same issue. If yes, the problem is likely in the municipal supply.
6. Contact Your Water Provider
If you find high metal levels, call your city water provider or plumber. They may flush pipes, adjust treatment, or suggest solutions.
7. Install A Filter
Install a certified filter for metals if your results show high levels. Choose filters tested to remove specific metals.
8. Maintain Plumbing
Replace old pipes and corroded fixtures when needed. Regular maintenance reduces metal buildup.
Credit: www.aquacure.co.uk
Common Problems And Solutions
Let’s look at the most frequent problems people face and how to solve them.
Problem: Old galvanized or iron pipes
Solution: Replace pipes with PVC or copper. This stops corrosion and metal leaching.
Problem: Well water with high iron or manganese
Solution: Use an iron filter or water softener. These devices trap metals before they reach your tap.
Problem: New copper plumbing
Solution: Flush the system by running water for several minutes each day until the taste fades.
Problem: Water softener not working
Solution: Service the softener and check for clogged filters.
Problem: Water tastes metallic only in the morning
Solution: This is often from water sitting in pipes overnight. Run the tap for a minute before drinking.
Problem: High metal levels in city water
Solution: Contact your provider. They may adjust pH or add corrosion inhibitors. In the meantime, use a certified water filter.
Maintenance Tips For Better Tasting Water
To keep your water tasting fresh and safe, follow these expert tips:
Flush rarely used taps weekly to prevent water from sitting in pipes.
Clean faucet aerators every three months to remove buildup.
Replace old or corroded pipes when remodeling.
Test well water once a year for metals and other contaminants.
Use a certified filter and replace cartridges as recommended by the maker.
If you notice new stains or odors, test water promptly.
Credit: www.simpurelife.com
Frequently Asked Questions
Why Does My Water Taste Metallic Only In The Morning?
Water that sits in pipes overnight can pick up more metals from corrosion. Running the tap for one or two minutes helps flush out the built-up metals, improving the taste.
Is Metallic Tasting Water Safe To Drink?
Small amounts of iron or manganese are not usually harmful. However, high levels of metals can cause health issues. It’s best to test your water and compare results with safe limits set by the EPA.
Can Boiling Water Remove The Metallic Taste?
Boiling water does not remove metals like iron or manganese. In fact, boiling can concentrate these minerals. Use a certified filter for effective removal instead.
How Can I Test My Water For Metals?
You can use a home test kit or send a sample to a certified laboratory. Labs provide accurate results for iron, manganese, copper, zinc, and other metals.
What Filter Should I Use For Metallic Taste?
Choose a filter certified to remove the specific metal found in your water. For iron and manganese, look for oxidation or ion exchange filters. For copper and zinc, activated carbon filters are often effective.
Key Takeaways
Metallic taste in water usually comes from dissolved metals like iron, manganese, copper, or zinc. This can happen due to old pipes, well water, or changes in water treatment.
Check for stains, test your water, and compare results with EPA guidelines. Regular plumbing maintenance and certified filters help prevent and solve metallic tastes. If unsure, always seek advice from a water quality expert.
Clear, good-tasting water is essential for health and peace of mind. Take action early if your water tastes metallic, and you can enjoy clean, refreshing water every day.
Hasan Al Sarker is a Reverse Osmosis Specialist. He has worked for many years to ensure safe drinking water for all. His research paper has been published in several journals, including Issue, Medium, and Slideshare. He is recognized as a water doctor among specialists though he did not attend medical college.
Besides working as a researcher of reverse osmosis technology, he is also very fancy with the kitchen and cooking. His guides are reading thousands of people every day. As a head of content, he is responsible for all the published articles at RO System Reviews.
Staying hydrated is often mentioned in weight loss advice, but many people overlook how powerful drinking water can be for reducing weight. Based on my years of experience coaching clients, I have seen that understanding the real impact of water on weight loss can make a big difference. This article will guide you through the science, practical steps, and expert tips for using water effectively to support your weight loss goals.
Understanding The Role Of Water In Weight Loss
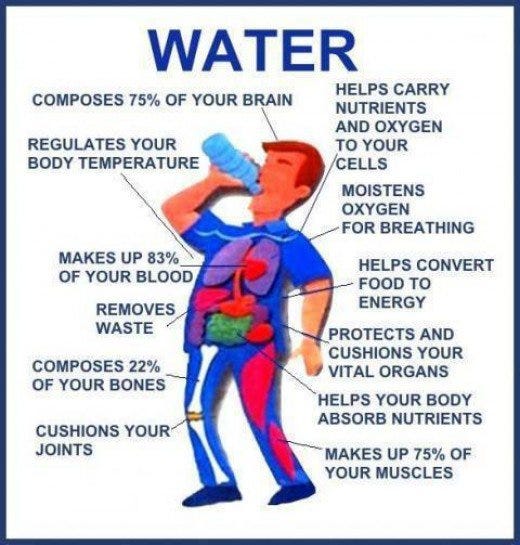
Many studies show that water supports key body functions that affect weight. Water makes up 50 to 60 percent of an adult’s body. It is involved in digestion, metabolism, and temperature control. When you do not drink enough water, your metabolism may slow down, and you might feel tired.
This can make it harder to stay active and burn calories.
Research from the journal Obesity shows that people who drank 500 ml (about 17 ounces) of water before meals lost up to 44 percent more weight over 12 weeks compared to those who did not increase their water intake. Water is more than a thirst-quencher—it is a real tool for weight management.
How Water Supports Weight Loss
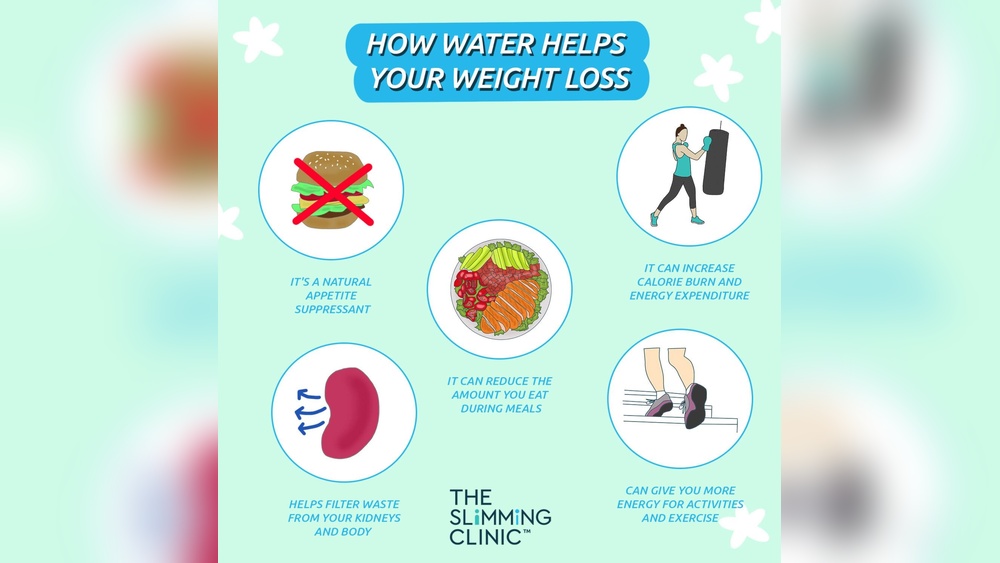
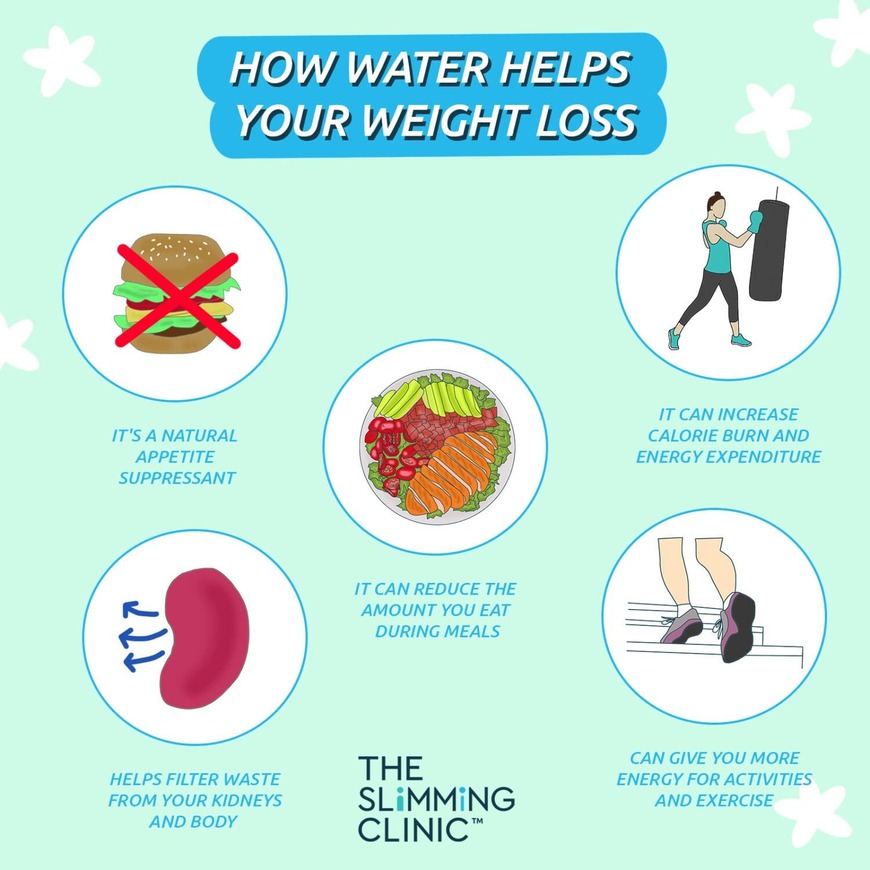
Water helps weight loss in several important ways. Here are the main mechanisms:
1. Boosts Metabolism
Drinking water can temporarily increase your metabolism. This effect is called water-induced thermogenesis. After drinking about 500 ml of water, your body’s energy use can rise by 24–30 percent for up to an hour. For example, if your normal resting energy burn is 1,500 calories per day, drinking water could help you burn an extra 60 calories per day.
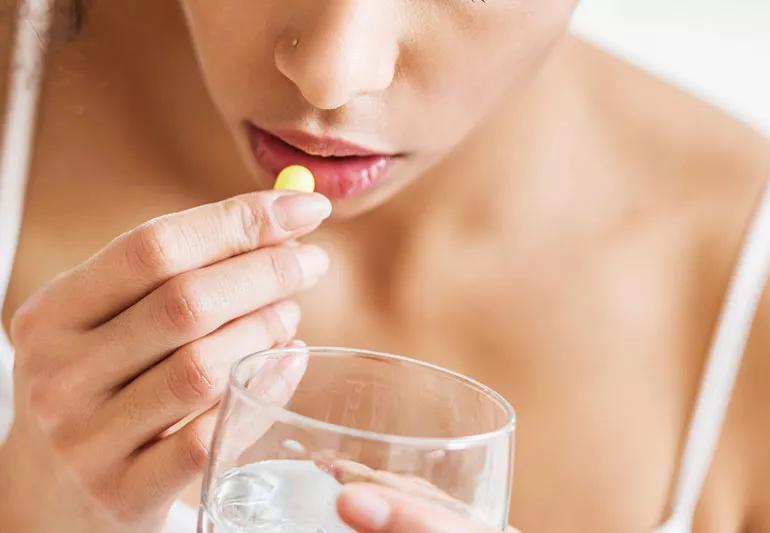
2. Reduces Appetite And Calorie Intake
Many people mistake thirst for hunger. When you are dehydrated, your body may send signals that make you want to eat, even if you are not truly hungry. Drinking a glass of water before meals can help you feel fuller, so you are likely to eat less. This small change can reduce your overall calorie intake and support steady weight loss.
3. Replaces Sugary Drinks
Switching from soda or juice to water can cut a lot of extra calories. A can of soda has about 140 calories and 39 grams of sugar. If you usually drink two cans per day and switch to water, you could cut 280 calories daily, which equals nearly 1,960 calories a week. Over time, this change alone can lead to steady weight loss.
4. Supports Exercise Performance
Hydration is key for effective workouts. When you are well-hydrated, your muscles work better, and you can exercise longer. This means you burn more calories and build more muscle, both of which help with weight loss.
5. Improves Digestion
Water helps break down food so your body can absorb nutrients. Good hydration also prevents constipation, which can sometimes cause temporary weight gain from water retention and bloating.
Why Water Intake Matters For Weight Loss
The amount of water you drink can directly affect your results. The Institute of Medicine recommends about 2.7 liters (91 ounces) for women and 3.7 liters (125 ounces) for men per day from all drinks and food. However, individual needs vary based on activity level, climate, and health.
Drinking enough water helps your body:
Use fat for energy (fat oxidation)
Remove waste and toxins
Maintain good muscle function
Prevent unnecessary snacking
Below is a summary of how water affects weight loss in practical terms.
Water Habit
Estimated Calorie Impact Per Day
Weight Loss Effect Over 1 Month
Drinking 500 ml before meals
40–60 calories burned
0.5 kg (1.1 lbs) lost
Switching 2 sodas to water
280 calories saved
1.1 kg (2.4 lbs) lost
Staying hydrated during workouts
More calories burned
Better performance and muscle gain
Practical Examples: How To Use Water For Weight Loss
Let me share a few examples from real clients and research:
Jane, a 35-year-old office worker, lost 6 pounds in two months by drinking a glass of water before every meal and replacing her afternoon soda with water.
In one study, overweight adults who increased their daily water intake by 1.5 liters (about 6 cups) lost an extra 2 kg (4.4 lbs) over 12 weeks, without any other diet changes.
Athletes who drank water regularly during exercise sessions burned more fat and maintained muscle mass better than those who started out even slightly dehydrated.
What these examples show is that small, consistent changes in water habits can add up to real results.
Signs You Need More Water
You might not always feel thirsty when your body needs more water. Here are some signs to watch for:
Dry mouth or lips
Dark yellow urine
Headaches
Low energy
Constipation
Feeling hungry soon after eating
If you notice any of these signs, try increasing your water intake for a few days and observe the difference.
Step-by-step Guidance For Using Water To Lose Weight
Here is a simple plan you can start today:
1. Calculate Your Daily Water Needs
Multiply your weight in kilograms by 0. 03. For example, if you weigh 70 kg, aim for about 2. 1 liters (70 x 0. 03 = 2. 1).
2. Drink A Glass Of Water Before Each Meal
This helps you feel full and may reduce your portion size.
3. Carry A Reusable Water Bottle
Keep it on your desk or in your bag. Refill it throughout the day.
4. Replace At Least One Sugary Drink With Water
If you drink soda, juice, or sweet tea, switch one serving per day to plain or sparkling water.
5. Drink Water During And After Exercise
For every 30 minutes of activity, drink at least 200–250 ml of water.
6. Flavor Your Water Naturally If Needed
Add lemon, cucumber, or mint for taste without extra calories.
7. Monitor Your Urine Color
Pale yellow usually means you are hydrated. Dark yellow means drink more.
8. Set Reminders
Use your phone or watch to remind you to sip water regularly.
9. Check Your Progress Weekly
Track your weight, energy, and how you feel. Adjust water intake as needed.
Credit: www.ctcd.edu
Common Problems And Solutions
Even with good intentions, some people face obstacles. Here are the most common problems and what you can do:
Problem: Forgetting To Drink Water
Solution:
Set phone alarms, keep a bottle within reach, or use apps that track water intake.
Problem: Not Liking The Taste Of Water
Solution:
Try adding a slice of lemon, orange, or a few berries for flavor. Cold water can taste better for some people.
Problem: Frequent Bathroom Trips
Solution:
This is normal at first. Your body will adjust within a few days. Try to spread your water intake evenly throughout the day.
Problem: Confusing Thirst With Hunger
Solution:
When you feel hungry, drink a glass of water first. Wait 10–15 minutes. If you are still hungry, have a healthy snack.
Problem: Drinking Too Much Water (water Intoxication)
Solution:
While rare, drinking more than 4–5 liters in a short time can be dangerous. Stick to recommended amounts, and listen to your body.
Maintenance Tips For Long-term Success
To keep seeing results, make these water habits part of your daily routine:
Start every morning with a glass of water.
Pair water drinking with other habits, like brushing your teeth or meal prep.
Refill your water bottle whenever it is empty.
Track your intake using a simple chart or app.
Adjust your water needs during hot weather or intense exercise.
With time, these habits become automatic, and your body will thank you with better energy and improved weight management.
Credit: medium.com
Key Information Summary
Here is a quick summary of the most important points for using water to help with weight loss.
Action
Benefit
Estimated Results
Drink water before meals
Reduces appetite
Eat 50–100 fewer calories per meal
Replace sugary drinks
Lowers calorie intake
Lose 0.5–1 kg per month
Stay hydrated for workouts
Burn more calories
Improved exercise results
Frequently Asked Questions
How Much Water Should I Drink For Weight Loss?
Most adults should aim for 2–3 liters per day, but needs can vary. A good rule is to drink enough so your urine is pale yellow. You can also use your body weight as a guide: 30–35 ml per kg per day.
Can I Drink Too Much Water?
Yes, drinking too much water very quickly can be dangerous and may cause a condition called hyponatremia. Stick to recommended amounts, and spread your intake over the day.
Does Drinking Cold Water Burn More Calories?
Drinking cold water does use a small amount of energy as your body warms it up, but the effect is minor—about 5–10 extra calories per glass. The main benefit is staying hydrated.
Is Sparkling Water As Good As Plain Water?
Yes, as long as it has no added sugar or sweeteners. Sparkling water hydrates you just like plain water and can be a good option if you prefer bubbles.
Can I Count Tea Or Coffee As Water?
Unsweetened tea and black coffee do count toward your daily water intake. However, avoid adding sugar or cream, as these add extra calories.
Credit: theslimmingclinic.com
Key Takeaway
Drinking enough water is a simple and effective way to help with weight loss. It works by boosting your metabolism, reducing appetite, and making it easier to avoid high-calorie drinks. Even small changes in your water routine can add up to real results over time. For more science-backed details, see this National Institutes of Health study and the CDC’s healthy hydration guide. Start today, track your progress, and see how proper hydration can support your weight loss journey.
Hasan Al Sarker is a Reverse Osmosis Specialist. He has worked for many years to ensure safe drinking water for all. His research paper has been published in several journals, including Issue, Medium, and Slideshare. He is recognized as a water doctor among specialists though he did not attend medical college.
Besides working as a researcher of reverse osmosis technology, he is also very fancy with the kitchen and cooking. His guides are reading thousands of people every day. As a head of content, he is responsible for all the published articles at RO System Reviews.